1.5 signac-flow Ideal Gas Example
About
This notebook contains a minimal example for running a signac-flow project from scratch. The example demonstrates how to compare an ideal gas with a Lennard-Jones fluid by calculating a p-V phase diagram.
Author
Carl Simon Adorf
Before you start
Make sure you installed signac and signac-flow, e.g., with:
conda install -c conda-forge signac signac-flow
[1]:
import flow
import numpy as np
import signac

# Enter the signac project directory
project = signac.init_project("projects/tutorial-signac-flow")
We want to generate a pressure-volume (p-V) phase diagram for an ideal gas.
We define a function to calculate the result for a given state point:
[2]:
def V_idg(N, p, kT):
    return N * kT / p
For this demonstration we will specialize a flow.FlowProject to manage our simple workflow.
The workflow will contain one label and one operation. - The label function allows us to label our jobs in the project status. This is especially important for understanding the state of large projects with expensive operations. - The operation function compute_volume is defined with a postcondition and will act on each job. This operation is eligible for execution if its postcondition is unmet (False).
[3]:
class MyProject(flow.FlowProject):
    pass


@MyProject.label
def estimated(job):
    return "V" in job.document


@MyProject.post(estimated)
@MyProject.operation
def compute_volume(job):
    job.document["V"] = V_idg(**job.statepoint())
We need to use the get_project() class method to get a project handle for this special project class.
[4]:
project = MyProject.get_project("projects/tutorial-signac-flow")
Now it’s time to actually generate some data! Let’s initialize the data space!
[5]:
for p in np.linspace(0.5, 5.0, 10):
    sp = dict(N=1728, kT=1.0, p=float(p))
    job = project.open_job(sp)
    print(job.id)
    job.init()
a14ee3104f26974b22bb84f62500c84d
55d4d6ebbc04a1f8a259a2c5de197328
4b299db86ff480f92e520eac91112108
26e2f19b5b211edb80ebe60a5a62bd75
75c10d0fa7a4f4b4742ce5e9c119e8bd
46859989efcfd89653fa65db2375884b
f3f3c351f81acd2140edd239b9183af4
b38e30524c2c36e3ebfe50481eb91992
bb277ac022ce744d38f9e87c1fabe08c
6f9bc79d670e42d4a40041ce7be9cdaf
The print_status() function allows to get a quick overview of our project’s status:
[6]:
project.print_status(detailed=True)
Overview: 10 jobs/aggregates, 10 jobs/aggregates with eligible operations.

label
-------


operation/group      number of eligible jobs  submission status
-----------------  -------------------------  -------------------
compute_volume                            10  [U]: 10

Detailed View:

job id                            operation/group     labels
--------------------------------  ------------------  --------
26e2f19b5b211edb80ebe60a5a62bd75  compute_volume [U]
46859989efcfd89653fa65db2375884b  compute_volume [U]
4b299db86ff480f92e520eac91112108  compute_volume [U]
55d4d6ebbc04a1f8a259a2c5de197328  compute_volume [U]
6f9bc79d670e42d4a40041ce7be9cdaf  compute_volume [U]
75c10d0fa7a4f4b4742ce5e9c119e8bd  compute_volume [U]
a14ee3104f26974b22bb84f62500c84d  compute_volume [U]
b38e30524c2c36e3ebfe50481eb91992  compute_volume [U]
bb277ac022ce744d38f9e87c1fabe08c  compute_volume [U]
f3f3c351f81acd2140edd239b9183af4  compute_volume [U]

[U]:unknown [R]:registered [I]:inactive [S]:submitted [H]:held [Q]:queued [A]:active [E]:error [GR]:group_registered [GI]:group_inactive [GS]:group_submitted [GH]:group_held [GQ]:group_queued [GA]:group_active [GE]:group_error
The next cell will attempt to execute all operations by cycling through jobs and operations until no next operations are defined anymore.
We limit the max. number of cycles to prevent accidental infinite loops, the number of cycles is arbitrary.
[7]:
project.run(num_passes=3)
Let’s double check the project status.
[8]:
project.print_status(detailed=True)
Overview: 10 jobs/aggregates, 0 jobs/aggregates with eligible operations.

label      ratio
---------  ----------------------------------------------------------
estimated  |████████████████████████████████████████| 10/10 (100.00%)

operation/group
-----------------


Detailed View:

job id                            operation/group    labels
--------------------------------  -----------------  ---------
26e2f19b5b211edb80ebe60a5a62bd75  [ ]                estimated
46859989efcfd89653fa65db2375884b  [ ]                estimated
4b299db86ff480f92e520eac91112108  [ ]                estimated
55d4d6ebbc04a1f8a259a2c5de197328  [ ]                estimated
6f9bc79d670e42d4a40041ce7be9cdaf  [ ]                estimated
75c10d0fa7a4f4b4742ce5e9c119e8bd  [ ]                estimated
a14ee3104f26974b22bb84f62500c84d  [ ]                estimated
b38e30524c2c36e3ebfe50481eb91992  [ ]                estimated
bb277ac022ce744d38f9e87c1fabe08c  [ ]                estimated
f3f3c351f81acd2140edd239b9183af4  [ ]                estimated

[U]:unknown [R]:registered [I]:inactive [S]:submitted [H]:held [Q]:queued [A]:active [E]:error [GR]:group_registered [GI]:group_inactive [GS]:group_submitted [GH]:group_held [GQ]:group_queued [GA]:group_active [GE]:group_error
After running all operations we can make a brief examination of the collected data.
[9]:
for job in project:
    print(job.statepoint()["p"], job.document.get("V"))
3.0 576.0
1.5 1152.0
4.5 384.0
2.5 691.2
3.5 493.7142857142857
2.0 864.0
5.0 345.6
0.5 3456.0
4.0 432.0
1.0 1728.0
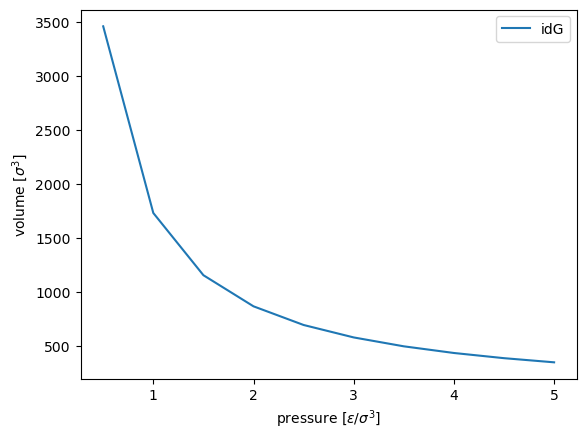
For a better presentation of the results we need to aggregate all results and sort them by pressure.
[10]:
%matplotlib inline

from matplotlib import pyplot as plt

V = {}

for job in project:
    V[job.statepoint()["p"]] = job.document["V"]

p = sorted(V.keys())
V = [V[p_] for p_ in p]
print(V)

plt.plot(p, V, label="idG")
plt.xlabel(r"pressure [$\epsilon / \sigma^3$]")
plt.ylabel(r"volume [$\sigma^3$]")
plt.legend()
plt.show()
[3456.0, 1728.0, 1152.0, 864.0, 691.2, 576.0, 493.7142857142857, 432.0, 384.0, 345.6]
Uncomment and execute the following line to remove all data and start over.
[11]:
# %rm -r projects/tutorial-signac-flow/workspace