2.2 Integration with pandas DataFrames
[1]:
%matplotlib inline
import matplotlib.pyplot as plt
import pandas as pd
import signac

project = signac.init_project("projects/dataframe-example")
We create a project with some sample data.
[2]:
funcs = {
    "abs": abs,
    "square": lambda x: x**2,
}

for x in range(-5, 6):
    job = project.open_job({"x": x})
    for name, func in funcs.items():
        job.document[name] = func(x)
Let’s first create a basic DataFrame from our project:
[3]:
df = project.to_dataframe()
df = df.sort_values("sp.x")
df
[3]:
| sp.x | doc.abs | doc.square | |
|---|---|---|---|
| 3c5a15f6f26125f2902f38ff28a94072 | -5 | 5 | 25 |
| 22749661e1ac649551a29953c93c9e92 | -4 | 4 | 16 |
| 9e892a750ef4bf5ca73069c249088d40 | -3 | 3 | 9 |
| 46049d7a2b36731d20af67766aadfeea | -2 | 2 | 4 |
| c887a273c9a550e883f09187b0e28eb7 | -1 | 1 | 1 |
| eff8ca15e7ca8ae5c09f011f997b34df | 0 | 0 | 0 |
| 27958648a9e57fcd66ae5e31ff3359e9 | 1 | 1 | 1 |
| 46c24d61c4220f8b62d2ae73d686ec18 | 2 | 2 | 4 |
| d832cd5075866a4973a78377f49f58a5 | 3 | 3 | 9 |
| 9cdfeafe274b4f1762f0bf885ca055b7 | 4 | 4 | 16 |
| 7e1046a94a75679fe7ac259e068afdb5 | 5 | 5 | 25 |
Now we can select specific data subsets, for example jobs with \(x=2\) or \(x^2 > 10\):
[4]:
df[(df["sp.x"] == 2) | (df["doc.square"] > 10)]
[4]:
| sp.x | doc.abs | doc.square | |
|---|---|---|---|
| 3c5a15f6f26125f2902f38ff28a94072 | -5 | 5 | 25 |
| 22749661e1ac649551a29953c93c9e92 | -4 | 4 | 16 |
| 46c24d61c4220f8b62d2ae73d686ec18 | 2 | 2 | 4 |
| 9cdfeafe274b4f1762f0bf885ca055b7 | 4 | 4 | 16 |
| 7e1046a94a75679fe7ac259e068afdb5 | 5 | 5 | 25 |
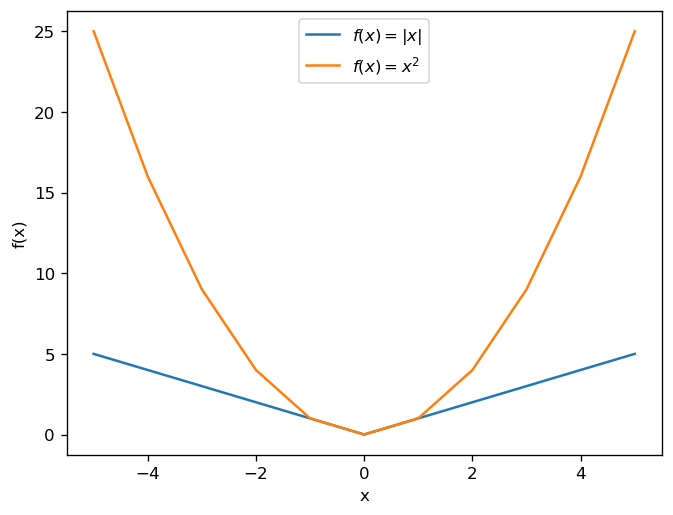
We can plot a graph from our pretend data using matplotlib:
[5]:
fig, ax = plt.subplots(dpi=120)
df.plot("sp.x", "doc.abs", ax=ax, label="$f(x)=|x|$")
df.plot("sp.x", "doc.square", ax=ax, label="$f(x)=x^2$")
ax.set_xlabel("x")
ax.set_ylabel("f(x)")
plt.show()
