3.1 Aggregation Tutorial
About
This notebook contains a minimal example for running workflows on aggregates of jobs using signac-flow.
Author
Hardik Ojha
Prerequisites
This notebooks requires the following packages:
signac-flow >= 0.15
numpy
matplotlib
Execute the command below to install the required packages:
pip install signac-flow>=0.15 matplotlib numpy
Definition
Aggregation allows a signac-flow operation to act on multiple jobs, rather than one job at a time.
An aggregate is defined as a subset of the jobs in a signac project. Aggregates are generated when the @flow.aggregator decorator is applied to an operation.
Please refer to the documentation for detailed instructions on how to use aggregation.
Objective
The goal of this project is to plot the temperature values present in a signac data space along with the average value of all the temperatures present.
Project Setup
Before we initialize a signac project inside the projects/tutorial-aggregation directory, we need to be sure that no such directory exists. Uncomment before executing the below cell to remove the directory if exists.
[1]:
# !rm -rf projects/tutorial-aggregation
[2]:
import datetime

import matplotlib.pyplot as plt
import numpy as np
import signac
from flow import FlowProject, aggregator

# Setting default figure size
plt.rcParams["figure.figsize"] = (10, 4)


# Initializing a signac project
project = signac.init_project("projects/tutorial-aggregation")
Initializing the data space
For the purpose of this notebook, we will be creating a random dataset using some mathematical calculations.
All the signac jobs will have two state point parameters and one document value.
job.statepoint["city"]: City for which data is being collected.job.statepoint["day"]: Day of the year.job.document["temperature"]: Average temperature for that day.
[3]:
days = np.arange(365)


def generate_temperatures(days, seed=None):
    rng = np.random.default_rng(seed)
    avg_temperature = 10 + rng.random() * 10
    annual_variation = -10 * np.cos(days / 365 * 2 * np.pi)
    random_variation = 5 * rng.random(len(days))
    temperatures = avg_temperature + annual_variation + random_variation
    return temperatures


temperatures = generate_temperatures(days, seed=123)

for day, temperature in zip(days.tolist(), temperatures.tolist()):
    # Create a signac job having the state point parameters 'day' and 'temperature'
    statepoint = dict(city="Anytown", day=day)
    job = project.open_job(statepoint)
    job.document["temperature"] = temperature
Let’s look at the project schema to see the jobs that were created.
[4]:
project.detect_schema()
[4]:
{
 'city': 'str([Anytown], 1)',
 'day': 'int([0, 1, 2, ..., 363, 364], 365)',
}
Creating a FlowProject with aggregate operations
In order to achieve our goal using signac-flow, we need to create a FlowProject and add operations to it. There will be following operations in our workflow:
compute_average_temperature: This operation computes the average temperature of the year and stores it in the project document. For this operation, all the jobs present in the signac project will be aggregated together. This will be the first operation to get executed in our workflow.plot_deviation_from_average: This operation plots the temperature (as a scatter plot) and the average temperature of the month. For this operation, all the jobs, when sorted by the state point parameterday, present in the signac project will be aggregated together. This will be executed after the operationcompute_average_temperature.
[5]:
class AggregationProject(FlowProject):
pass
@AggregationProject.post(lambda *jobs: project.doc.get("average_temperature", False))
@AggregationProject.operation(aggregator=aggregator())
def compute_average_temperature(*jobs):
"""Compute the average temperature using the state point parameter,
"temperature", of all jobs present in the signac project and
store the computed value to the project document.
"""
average_temp = np.mean([job.document["temperature"] for job in jobs])
project.document["average_temperature"] = float(average_temp)
@AggregationProject.pre.after(compute_average_temperature)
@AggregationProject.operation(aggregator=aggregator(sort_by="day"))
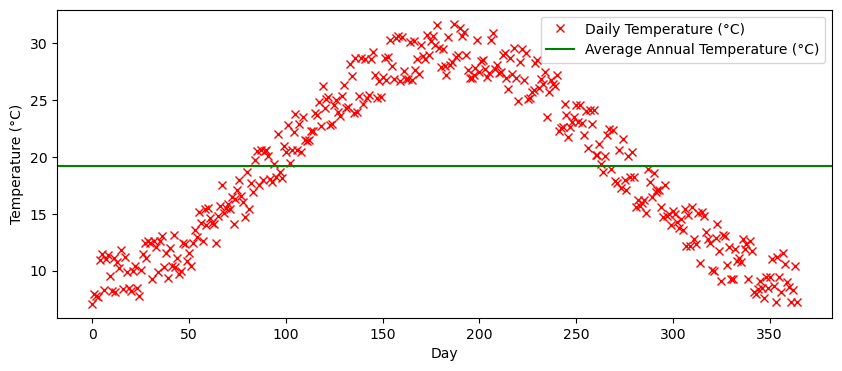
def plot_daily_temperature(*jobs):
"""Graph of daily temperature for the year."""
print("Generating plot of daily temperature.")
average_temp = project.document["average_temperature"]
days = [job.sp["day"] for job in jobs]
fig, ax = plt.subplots()
ax.plot(
days,
[job.document["temperature"] for job in jobs],
"rx",
label="Daily Temperature (°C)",
)
# Plot the average as a line
ax.axhline(average_temp, c="green", label="Average Annual Temperature (°C)")
ax.legend()
ax.set_xlabel("Day")
ax.set_ylabel("Temperature (°C)")
plt.show()
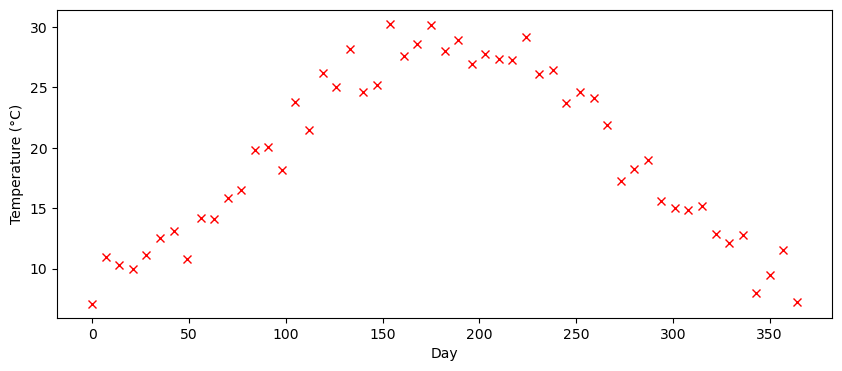
every_sunday = aggregator(sort_by="day", select=lambda job: job.sp["day"] % 7 == 0)
@AggregationProject.operation(aggregator=every_sunday)
def plot_weekly_temperature(*jobs):
"""Graph the temperature for only one day of each week."""
print("Generating plot of weekly temperature.")
days = [job.sp.day for job in jobs]
fig, ax = plt.subplots()
ax.plot(
days,
[job.document["temperature"] for job in jobs],
"rx",
label="Daily Temperature (°C)",
)
ax.set_xlabel("Day")
ax.set_ylabel("Temperature (°C)")
plt.show()
Executing the workflow
Initializing the FlowProject
In order to register the operations, conditions, and the aggregators associated with the project we created, we need to initialize a FlowProject. Since the signac project does not belong in the current directory, we specify its path to FlowProject.get_project.
[6]:
flow_project = AggregationProject.get_project(project.path)
Running the workflow
The FlowProject.run method allows the execution all eligible operations in the FlowProject.
[7]:
flow_project.run()
Generating plot of weekly temperature.
Operation 'plot_weekly_temperature' has no postconditions!
Generating plot of daily temperature.
Operation 'plot_daily_temperature' has no postconditions!
Operation 'plot_weekly_temperature' has no postconditions!
Summary
We have successfully plotted the temperature values present in a signac data space along with the average value of all the temperatures present using the aggregation feature of signac-flow.
To learn more about how to use aggregation, see the documentation on aggregation.